Gold 2023: Stagflation's Uncrowded Trade
More stagflation ahead. But gold investment...?
MUCH TOO-ING and fro-ing in gold and the other precious metals' prices, writes Adrian Ash at BullionVault in this, the last Weekly Update of 2022 to the bullion marketplace's global users, sent on Monday.
But as we near the end of the worst year ever for investors (copyright, all financial pundits) how have gold and silver performed?
It's a weak field. But with both precious metals now trading back up to unchanged for Dollar investors across 2022, physical bullion stands out as this year's best performing tradable asset outside energy commodities.
First, let's put crypto to one side.
Let's also agree, once and for all, that whatever 'digital currencies' may become, the idea that they offer any kind of safe haven for investors...never mind a replacement for precious metals as a portfolio asset...is over, finished, kaput.
Compared to Bitcoin's 65% plunge, more traditional investments merely damaged your wealth instead of destroying it. But looking at the 2 biggest buckets of tradable wealth worldwide – fixed-income debt and stock market shares – they both had a shocker as well.
Bonds got crushed, first by inflation in the cost of living soaring to 4-decade highs and then by central banks trying to fix that disaster by raising their short-term interest rates.
Longer-term interest rates had to rise in response. And because the yield offered by a bond moves in the opposite direction to its price, that meant bond prices had to sink.
Which they did. So too did equities.
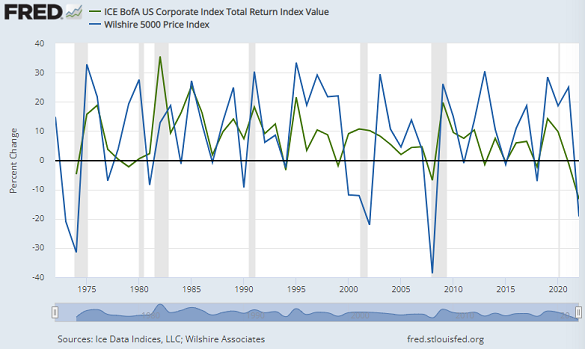
US corporate bonds (in green) haven't had such a rough year since, well, since forever on the available data.
US stock markets also sank in 2022 (the blue line above), delivering their worst year so far this century outside the DotCom Crash of 2002 and the Global Financial Crisis of 2008.
Added together, this creates the worst year in a decade and a half for a typical portfolio mixing bonds and shares. Or maybe the worst in 60 years. Or maybe the worst since 1931. Or maybe forever.
Whatever the record just set, might the pain continue?
Well, the 2022 wipe-out still leaves those asset prices pretty high.
US corporate bond prices, for instance, remain 25% higher from a decade ago, having unwound only the last 3 years of price gains.
And at this level, corporate debt offers to pay new buyers a yield somewhere around 5% per year.
That's still negative in real terms, of course, trailing headline CPI inflation by two whole percentage points per year right now.
US shares, meanwhile, remain above where they began 2021 on the Wilshire 5000 index.
Back then, some pundits and analysts (ahem) said the bubble just couldn't keep floating...
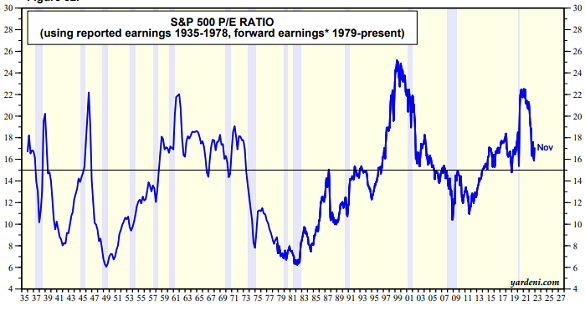
...pointing to a price/earnings ratio far above historic norms, way up at the highest since the DotCom Bubble inflated to its New Year 2000 peak and went bang.
This year's steep price drop has corrected that huge over-valuation. Buying shares in US Inc. now costs, on average, the equivalent of 17 years of their corporate earnings at current levels, down from the pandemic's peak above 22.
But that still only puts the US P/E ratio back at its historic average, rather than screaming 'buy!'
It also misses the fact that, going into 2023, those corporate earnings may well struggle as recession bites, with consumers losing jobs and access to credit and top of the real income already lost to this year's 4-decade highs for inflation.
Big falls in the stock market, of course, are always followed by big rebounds.
Except that they're not.
Yes, the 38% crash of 2008 then saw the US stock market rally 26% in 2009.
But while that kicked off a 4-fold increase in share prices across the following decade, it also jars with how the Year 2000's loss of 12% was matched by another 12% drop in 2001 and then a 22% plunge in 2002.
More telling perhaps for the shape of 2023 is how the 21% drop in US share prices of 1973 wasn't in fact driven by the First Oil Crisis starting that October. But once the Saudi oil embargo took hold, and the cost of living soared as energy costs leapt, that plunge in US equity values was followed by a 31% plunge in 1974 as well.
Then, as now, an anxious investor wanting to avoid more pain might be tempted to switch into cash. Because at least cash can't lose value in cash terms, right?
Thing is, both in the early-to-mid 1970s and here again a half century later, sitting safe in cash has guaranteed a loss of real value. Because of runaway inflation.
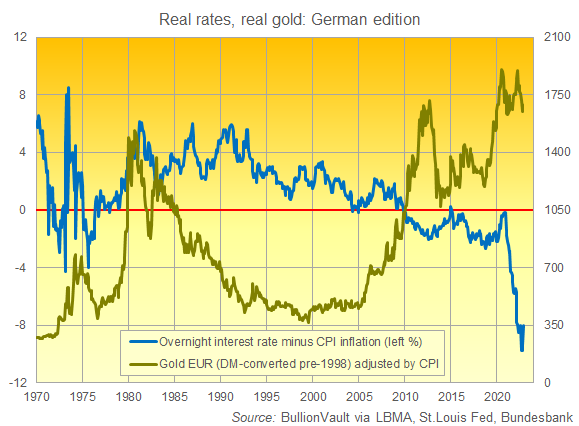
This chart shows how Germany, the world's 4th largest economy, has never seen the returns paid to cash savings lag so far behind the cost of living.
The European Central Bank's latest rate hike took deposit rates up to 2.0% per year.
Inflation in Germany last month ran above 10.0%.
So just as everywhere else, cash in the bank hasn't offered any kind of protection from the mayhem caused to stocks and bonds by the same root problem. Meaning inflation.
Looking ahead, everyone expects inflation to ease back in 2023.
Oil and gas prices are already flat or lower from 12 months ago. Simple maths alone will see annual inflation rates ease back, unless there's a fresh upturn in energy costs.
But the macro consensus still sees stagflation everywhere, meaning weak growth plus high inflation. That gloom has become so universal, it suggests that better risk/reward trades might come from taking a different view.
Yet the stagflation outlook isn't getting any follow-through from wealth managers, because investors continue to shun gold, the stand-out trade when weak growth meets high inflation.
ETF holdings are down sharply this year and vaulted bullion holdings have flat-lined. 2022's weakness in portfolio gold additions isn't surprising, because interest rates surged with the Dollar, reducing the appeal of gold as a non-yielding Dollar hedge. But this year's resilience in bullion prices makes a stark contrast with the 2013 crash, and it also contrasts with the worst year in living memory for equity/bond portfolios.
What comes next? Gold's value as a portfolio diversifier is likely to gain attention around the New Year, both because of seasonal rebalancing...
...(you look ahead, see no end of trouble, and add a little gold as insurance)...
...and also because January brings Chinese New Year, now the heaviest single gold-buying festival worldwide.
Those two factors mean that gold typically sees a strong rise in January. Gold has risen 14 times at New Year over the last two decades in Dollar (and Euro) terms, matching the monthly strike rate of November but with January averaging overall average gains almost twice as strong at 2.9%.
2021 and 2022 snapped that pattern, with gold prices falling in both of those Januarys. But gold hasn't failed to rise in January for more than two years running for more than two decades in Dollar terms, and it's never fallen for more than three Januarys in a row since the bullion market was de-linked from the global monetary system with the late 1960s' collapse of the Bretton Woods Dollar-gold exchange system.
Beyond the New Year, 2023 clearly presents a risk to precious metals if the Fed and other major central banks defy the stock-market's pleas for a 'pivot' in the face of the coming global recession.
But two thoughts.
First, and as a chart of real interest rates anywhere from the US to the UK to Japan will show, the long-term downtrend in the real return paid to cash (or asked of borrowers) remains very much alive and kicking.
Those real returns may have turned higher, for sure. But the 4-decade downtrend remains.
I mean, just check out the German experience above!
Second though, and if real interest rates do rise further...and if they do also regain their negative impact on gold prices which the metal broke free from this year...then the price floor from jewellery buyers and especially Asian consumer demand is likely to provide strong support.
Indeed, that price floor may already be here. Because China and India's combined demand has already regained pre-pandemic levels, only with prices $500 per ounce higher.
Nothing is certain, of course. Which is precisely why precious metals make sense as a part of a wider spread of investments.
Early in the New Year, we shall look at where BullionVault users think the precious metals market is headed in 2023, and why.
Meantime, you can review how gold prices have moved month by month over the last 20 years here on this infographic.


 Email us