How to embed the BullionVault chart on your website
This page explains how to add the BullionVault chart to a website and lists all the available configuration options that can be used to customize the chart. You may also be interested in embedding a customisable BullionVault price widget. While we endeavour to provide a reliable and accurate service, BullionVault makes no guarantees of the stability of the price charts or widgets or the accuracy of the data they provide.
Loading the chart library
The chart library is written in javascript and is hosted on BullionVault‘s server. There is no need to download the library to any other server. Just add the following script tag into the head element of the page you want to embed the chart into.
	<!doctype html>
	<head>
		<script type="text/javascript" src="https://www.bullionvault.com/chart/bullionvaultchart.js?v=1"></script>
	</head>
Creating a chart instance
The chart is added by calling BullionVaultChart constructor with two arguments. The first argument is an associative array with configuration options. All available options are listed below. The second argument is the ID of the DOM element the chart should embed into. This can be a DIV or any other block element.
	<div id="chartContainer" style="height: 300px; width: 500px;"></div>

	<script type="text/javascript" >
		var options = {bullion: 'gold'};
		var chartBV = new BullionVaultChart(options, 'chartContainer');
	</script>
Chart initialization options
| bullion | Selects the bullion type to display. Note that if the buttons for switching bullion are displayed in the button panel (switchBullion), the user setting stored in a cookie takes priority over this option. Accepted values: 'gold', 'silver', 'platinum' or 'palladium' |
| currency | Selects the currency which should be displayed. Note that if the drop-down list for switching currency is displayed in the button panel (switchCurrency), the user setting stored in a cookie takes priority over this option. Accepted values: 'USD', 'GBP', 'EUR', 'JPY', 'AUD', 'CAD', 'CHF' |
| timeframe | Selects time frame to display - from 10 minutes to 20 years. Note that if the buttons for switching timeframe are displayed in the button panel (switchTimeframe), the user setting stored in a cookie takes priority over this option. Accepted values: '10m', '1h', '6h', '1d', '1w', '1m', '1q', '1y', '5y', '20y' |
| chartType | Represents chart series type. The supported types are Line and High-Low-Close. Note that if the drop-down list for switching chart type is displayed in the button panel (switchChartType), the user setting stored in a cookie takes priority over this option. Accepted values: 'line' or 'hlc' |
| miniChartMode | Switches chart to the “Minichart“ mode, which supports very small sizes, but lacks some features. This mode is ideal for embedding the chart in the side column of your website. Accepted values: true or false |
| miniChartModeAxis | Specifies which y-axis should be displayed in miniChartMode. Accepted values: 'kg', 'oz' or 'both' |
| referrerID | If you participate in our referral program use this parameter to get rewarded for the new customers you send to our website via links in the chart. Accepted values: Your BullionVault username, e.g. 'MYUSERNAME' |
| containerDefinedSize | Controls whether the size of the chart should adjust to its parent element (the containing div) or whether it will adjust to the the window (or an iframe) and resize itself accordingly. Accepted values: true or false |
| displayLatestPriceLine | Show / Hide the line indicating latest price and the time of the last update. Accepted values: true or false |
| switchBullion | Show / Hide buttons for changing the bullion. Accepted values: true or false |
| switchCurrency | Show / Hide the drop-down list for changing the currency. Accepted values: true or false |
| switchTimeframe | Show / Hide the buttons for changing the time frame. Accepted values: true or false |
| switchChartType | Show / Hide the drop-down list for changing the chart type. Accepted values: true or false |
| exportButton | Show / Hide the export button which allows users to download the chart data as a CSV file. Accepted values: true or false |
Notes on options
- Switches that accept quoted values are case insensitive.
- Your referrerID will be your BullionVault username. i.e. if your username is JOHNSMITH101, you should enter this as your referrerID.
- MiniChartModeAxis switch is not taken account of unless miniChartMode is true.
- Control elements switches (such as switchBullion, switchCurrency, switchTimeframe, switchChartType and export) aren't taken account of if the chart is in miniChartMode. All control elements are disabled in this mode.
Examples of use
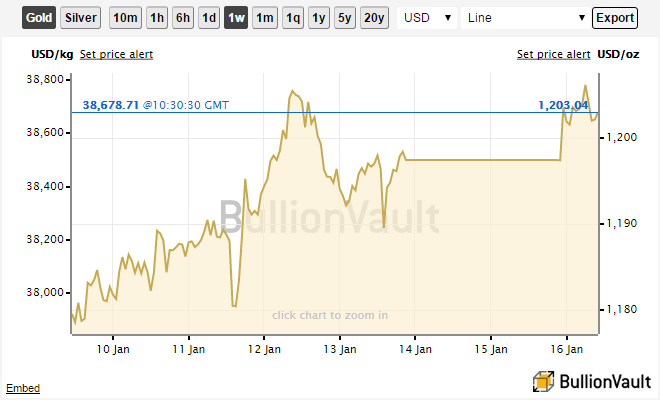
Variant 1: Normal chart set to gold per USD in kilograms and ounces in frame of 1 week in line mode having size 660x400px with all controls enabled.
	<html>
	<head>
		<script type="text/javascript" src="https://www.bullionvault.com/chart/bullionvaultchart.js" ></script>
		<script type="text/javascript" >
			var options = {
				bullion: 'gold',
				currency: 'USD',
				timeframe: '1w',
				chartType: 'line',
				miniChartModeAxis: 'both',
				referrerID: 'MYUSERNAME',
				containerDefinedSize: true,
				miniChartMode: false,
				displayLatestPriceLine: true,
				switchBullion: true,
				switchCurrency: true,
				switchTimeframe: true,
				switchChartType: true,
				exportButton: true
			};
			var chartBV = new BullionVaultChart(options, 'embed');
		</script>
	</head>
	<body>
	<div id="embed" style="height: 400px; width: 660px; "></div>
	</body>
	</html>
The resulting chart is below:
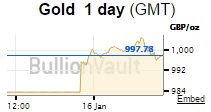
Variant 2: Embedded minichart set to gold per GBP in ounces in frame of one day in line mode having size 170x105px.
	<html>
	<head>
		<script type="text/javascript" src="https://www.bullionvault.com/chart/bullionvaultchart.js" ></script>
		<script type="text/javascript" >
			var options = {
				bullion: 'gold',
				currency: 'GBP',
				timeframe: '1d',
				chartType: 'line',
				miniChartModeAxis: 'oz',
				referrerID: 'MYUSERNAME',
				containerDefinedSize: true,
				miniChartMode: true,
				displayLatestPriceLine: true,
				switchBullion: true,
				switchCurrency: true,
				switchTimeframe: true,
				switchChartType: false,
				exportButton: true
			};
			var chartBV = new BullionVaultChart(options, 'embed');
		</script>
	</head>
	<body>
	<div id="embed" style="height: 115px; width: 170px; "></div>
	</body>
	</html>
The resulting chart is below: