Dow/Gold Ratio Sinks to '87 Crash Low
Summer crash 2011 takes Dow/Gold Ratio down below 6.0...
STOCKS or gold...? Growth or preservation? Right now, amid the summer crash of 2011, Mr.Market's choice is plain, writes Adrian Ash at BullionVault.
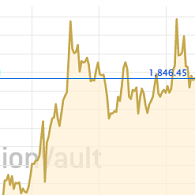
The Dow/Gold Ratio – a simple measure of the US stock market's valuation in ounces of gold – has sunk so far this August. Dropping through 6.0 ahead of Friday's New York opening, the Dow/Gold Ratio hasn't been this low since early 1989, back when world equity markets were recovering from the Great Crash of Black Monday 1987.
That slump itself had taken the Dow/Gold Ratio all the way down to 3.6, with Gold Prices rising to nearly $500 per ounce as the Wall Street index sank to 1776 points. Growth, of course, was only taking a pause in late 1987 – a quick breather before the real race to perfection of the 1990s. Whereas today?
The Dow/Gold Ratio could still go a lot further down, or so says history. Trading at barely half its century-long average today, the ratio bottomed during the 1930s Great Depression at just below 2.0. At the nadir of the next global depression – the inflationary depression of the early 1980s – the Dow/Gold Ratio sank even lower, down to 1.0.
Whatever flavor of depression we've got at the start of this decade – and it is a depression, as Western jobs data continue to show – a growing flow of private savings is choosing preservation in gold over business-risk in equities. That might sound self-fulfilling, a kind of "clinical disorder" open to psychiatric or government cure. But so far, only a small portion of the money fleeing equities is finding its way into bullion. From here to a true depression low in Dow/Gold (if such a level is reached), today's gold buyers would still get to look early as the economy catches up with the latest panic in stocks.
Ready to Buy Gold today...?