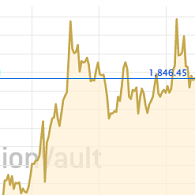
Gold Price: Volatility Ahead
Unmoved by Egypt, the Gold Price looks set for increased volatility...
THE WEAK RESPONSE of the Gold Price to the Egyptian crisis has puzzled many investors, writes Brad Zigler at Hard Assets Investor.
You'd think the gold market would reflect growing fear of Middle Eastern
unrest, sending Gold Prices higher. But despite last week's escalation
in violence, bullion prices slumped $8 an ounce mid-week. The price
decline bespeaks an overreaction on Friday, when gold jumped $14 an
ounce.
Such is volatility. But gold market volatility has actually diminished
recently. Or, rather, expected volatility – as measured by the options
market – has shrunk.
The CBOE Gold Volatility Index is derived from the implied volatility in
the premiums asked for options on the SPDR Gold Shares Trust (NYSE
Arca: GLD) – a proxy for Gold Bullion ownership, which closely tracks the price. And if you've tracked
it over the past couple of months, you probably have noticed that
readings have moved into an ever-tightening range:
Investors with experience in chart reading may recognize the pattern
that's developed; the "wedge" looks predictive of a break-out move. But
which way will Gold Prices be moving when volatility jumps?
Gold's recent track record and a little probability theory can help sort out the odds.
First, we need to get our volatility bearings. The GLD Gold ETF's
history reiterates a pattern of falling prices accompanied by low
variance:
Period (GLD Trust) |
High Price |
Low Price |
Period Gain/Loss |
Actual Volatility |
Last 30 days | 138.00 | 127.93 | -5.5% | 16.3% |
Last 60 days | 139.11 | 127.93 | -5.5% | 15.9% |
Last 90 days | 139.11 | 127.93 | -0.9% | 17.5 |
GLD's current volatility readings are historically low. In fact, they
are in the tenth percentile of the trust's 600-day range. In comparison,
the average CBOE Gold Volatility Index reading since its 2008 inception
date is 27.1%.
With this data in hand, we can forecast the probabilities of breakout
moves over one-, two- and three-month horizons. Let's start with the
next 30 days...
Level |
End of Period |
Any time During Period |
> 138.00 | 11.0% | 22.2% |
< 129.93 | 34.7% | 68.3% |
In between | 54.3% |
Currently, GLD trades at the $129-$131 level, closer to the trust's
30-day low than its high. Odds are better than even that GLD will finish
the next 30 days at a price within its near-term range. The possibility
of a downside excursion sometime within the next month, however, is
better than 2-in-3.
Over the next 60 days, the data look like this...
Level |
End of Period |
Anytime During Period |
> 139.11 | 15.2% | 30.9% |
< 129.93 | 39.3% | 77.0% |
In between | 45.5% |
The downside bias increases if we stretch out the investment horizon
another month. Still, the ending price is more likely to be somewhere
between the past 60 days' high and low.
And over the next 90 days...
Level |
End of Period |
Anytime During Period |
> 139.11 | 21.7% | 44.5% |
< 127.93 | 42.8% | 83.0% |
In between | 35.5% |
In the next three months, the likelihood of GLD's price breaking below
the $128 level becomes more compelling. A lower ending price is, in
fact, the most likely outcome, though not by an exceedingly large
margin.
A Caveat: Probabilities are, of course, just that. There's no
certainty that these Gold Price scenarios will actually unfold. Even so,
there's more than just guesswork involved here. The market's pulse is
reflected in these prognostications, but investors should keep in mind
that unforeseen circumstances can radically alter the odds of exceeding
the benchmark Gold Prices.
One thing's certain. The low volatility assumption bids into option
prices and makes the contracts relatively cheap. Traders with market
opinions will find option purchases – calls, if bullish, and puts, if
bearish – favorable now.
Get the safest gold at the lowest prices using BullionVault...