Gold News

Debt Ceiling Gold: 18 Cents per $1 Billion
2011 gold panic not replayed in 2023...
 
JOE BIDEN's Democrat White House says it has struck a deal with Republican opponents over raising the US debt ceiling, writes Adrian Ash at BullionVault.
 
With next Monday's default deadline fast approaching, that just about gives Washington the chance to get this new debt limit deal through the House and Senate before running out of money on 5th June, when the Treasury estimates it will exhaust today's lawful borrowing capacity.
 
As the pantomime has rolled on, many analysts have pointed to the 2011 debt-ceiling crisis as an example of how financial markets will panic at the threat of the world's most powerful government defaulting on its debts because it can't borrow any more.
 
Bank of America, for instance, looked back 12 years and found that high-risk call options on gold prices, plus high-risk puts against the stock market, offer "cheap lottery tickets" on today's brinkmanship taking the world over the brink.
 
Fellow US bank J.P.Morgan has also been advising clients to buy gold, as well as hold cash and sell stocks, because financial markets haven't yet "priced in a material risk" of the dreaded 'x-date' arriving before the House and the Senate vote to make the deal law.
 
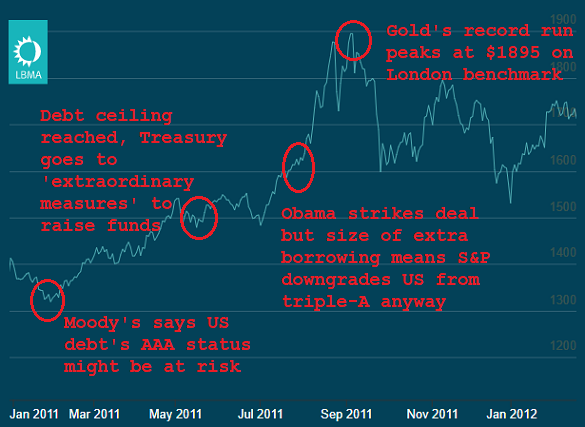
Chart of London PM gold price benchmark. Source: LBMA chart, notes from BullionVault
 
However, while July 2011 saw gold leap 8.2% as that year's debt-ceiling deadline approached, the precious metal leapt faster still once a deal was agreed, jumping to new all-time highs on the day Obama signed it and rising 11.3% across August.
 
The price of gold then peaked on 6th September 2011, with spot touching $1920 per Troy ounce and the London benchmark fixing at $1895, both of which remained a record until gold's Covid Crisis peak of 2020.
 
All told, in fact, the preceding panic and then initial shock at the additional borrowing sanctioned by Obama's 2011 debt deal with the Republicans – which, in the end, raised the ceiling by $2.1 trillion – added $387 per ounce to the price gold.
 
That equated to $0.18 per ounce for every extra $1 billion of US borrowing...
 
...a miserly boost, you might think, given that 2011's new debt ceiling of $16.4 trillion (just half of where today's negotiations start from) saw the United States' credit rating downgraded from 'outstanding' triple-A status by global specialists Standard & Poor's. That pulled the rug from beneath the entire financial world's basic modelling by destroying its 'risk free' reference point.
 
What's more, gold then gave back most of those gains almost as fast as it had acquired them over the 2 months following its September 2011 peak. But even so, it had made a 27% jump inside 10 weeks, still the 2nd fastest such move of the 21st Century to date against the US Dollar.
 
Because when everything falls over, money runs into gold. Right?
 
Sure, the Eurozone debt crisis added to gold's momentum in summer 2011, as did the worst rioting across England for 200 years. But it's not like the UK and Europe don't offer good reasons here in 2023 for investors to buy gold again, on top of the US debt debacle, today.
 
So how come gold prices aren't surging once more?
 
I mean, ratings agency Fitch has now threatened to downgrade the USA from AAA – a mere 12 years after S&P did – because of this latest debt-ceiling crisis. Yet gold bullion is now more than $100 off its current all-time high of $2067...
 
...and this month's average price so far has slipped $6 from gold's new record month-average of $2000 per ounce set this April.
 
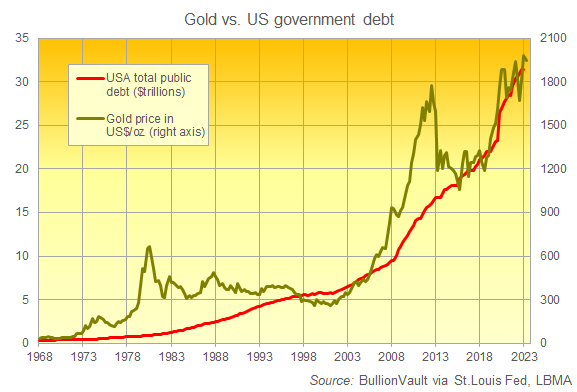
Chart of US total public debt vs. gold priced in Dollars. Source: BullionVault
 
The difference?
 
Unlike 2011, this year's US debt-ceiling argument gas failed to send other financial markets into a panic. Whether or not there's a real crisis to worry about, bonds and stocks are trading like there really isn't, meaning that investors aren't seeking insurance in the way that they did 12 years ago. And so that means gold hasn't responded to the debt-ceiling issue like it did in 2011.
 
The S&P 500, for instance, is making new highs for 2023, rising almost 10% since New Year and reaching the highest since last August. 2011, in contrast, saw the US stock market sink amid that summer's debt-ceiling crisis, losing over 6% for the year by early August and dropping almost 14% from the 3-year high reached 4 months earlier.
 
Bond prices have also flipped the 2011 pattern on its head, trading flat-to-falling – and therefore driving longer-term borrowing costs higher – rather than pulling interest rates lower as did the flight into Uncle Sam's loving embrace 12 years ago.
 
That rush to safety – albeit into the very thing which everyone feared would be in default – meant 10-year US Treasury yields dropped almost half-a-point between New Year and early August 2011, before plunging into September to trade below 2.00% per annum for only the second time in history, matching the record lows of the Second World War.
 
Here in 2023, in contrast, 10-year Treasury yields have held firm around 3.80% per annum after falling but then regaining half-a-point as this year's US debt-limit pantomime and the continued strength of inflation have pushed the regional banking sector's mini-crash out of the headlines.
 
Betting has also jumped that the US Fed will raise or hold its target interest rate at today's 16-year high of 5.25%, with the futures market now forecasting no change by Christmas 2023 after predicting a level of 4.60% back at the start of this year.
 
That has helped the Dollar to rebound from its banking mini-crisis lows as well, putting its exchange rate against the rest of the world's major currencies back at what was a 2-decade high when first reached in May 2022. The debt-ceiling debacle of 2011, on the other hand, saw the Dollar Index struggling near the all-time record lows of 3 years earlier, back when Bear Stearns' collapse marked the start of the true crisis phase of the global financial crisis.
 
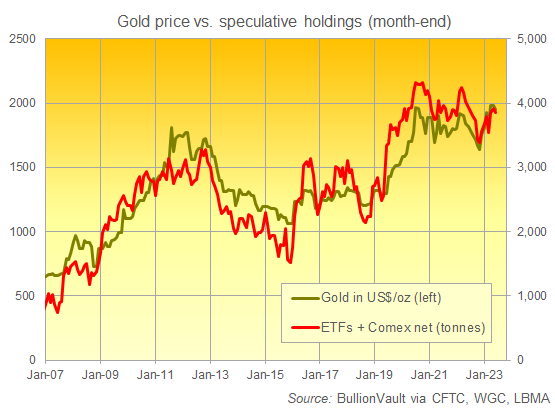
Net result? The size of investor holdings in gold-tracking products continues to track the gold price closely, just like it always does. But where hot money traders in Comex derivatives, plus investors holding gold ETF shares, went into the 2011 debt-ceiling crisis with new record-high exposure to the precious metal, they are currently less exposed to gold than they were when prices were $150 lower from today back last autumn, pulling back as a group from the Covid pandemic anf then Russian-invasion-of-Ukraine peaks overall despite the precious metal's underlying price rise.
 
Chart of Managed Money's notional net long in Comex gold derivatives plus total global gold ETF holdings. Source: BullionVault
 
Even so, and with investment inflows soft on a comparative basis, gold prices remain high by historical standards, and while the precious metal has lost the $2000 level for now, the underlying price continues to hold very firm, supported by Asian consumer demand as well as by ongoing central-bank gold purchases.
 
The fact that prices are this high in the absence of heavy investment demand suggests there is lots of scope for gold to rise sharply when financial markets next hit trouble, whether or not that's led by anxiety over the USA's massive and growing public debt.
 

Adrian Ash

Adrian Ash, BullionVault Gold News

Adrian Ash is director of research at BullionVault, the world-leading physical gold, silver and platinum market for private investors online. Formerly head of editorial at London's top publisher of private-investment advice, he was City correspondent for The Daily Reckoning from 2003 to 2008, and he has now been researching and writing daily analysis of precious metals and the wider financial markets for over 20 years. A frequent guest on BBC radio and television, Adrian is regularly quoted by the Financial Times, MarketWatch and many other respected news outlets, and his views from inside the bullion market have been sought by the Economist magazine, CNBC, Bloomberg, Germany's Handelsblatt and FAZ, plus Italy's Il Sole 24 Ore.

See the full archive of Adrian Ash articles on GoldNews.

Please Note: All articles published here are to inform your thinking, not lead it. Only you can decide the best place for your money, and any decision you make will put your money at risk. Information or data included here may have already been overtaken by events – and must be verified elsewhere – should you choose to act on it. Please review our Terms & Conditions for accessing Gold News.

Follow Us

Facebook Youtube Twitter LinkedIn


Market Fundamentals