Call That a Gold Forecast? Try THIS
First, assume a gold standard. Next...
I HAVE previously said that gold could reach $15,000 by 2026, says Jim Rickards in The Daily Reckoning.
Today, I'm updating that forecast. Gold may actually exceed $27,000.
I don't say that to get attention or to shock people. It's not a guess; it's the result of rigorous analysis.
Of course, there's no guarantee it'll happen. But this forecast is based on the best available tools and models that have proved accurate in many other contexts.
Here's how I reached that price level forecast.
This analysis begins with a simple question: What's the implied non-deflationary price of gold under a new gold standard?
No central banker in the world wants a gold standard. Why would they? Right now, they control the machinery of global currencies (also called fiat money).
They have no interest in a form of money they can't control. It took about 60 years from 1914-1974 to drive gold out of the monetary system. No central banker wants to let it back in.
Still, what if they have no choice? What if confidence in command currencies collapses due to some combination of excessive money creation, competition from Bitcoin, extreme levels of Dollar debt, a new financial crisis, war or natural disaster?
In that case, central bankers may return to gold not because they want to, but because they must in order to restore order to the global monetary system.
That scenario begs the question: What is the new Dollar price of gold in a system in which Dollars are freely exchangeable for gold at a fixed price?
If the Dollar price is too high, investors will sell gold for Dollars and spend freely. Central banks will have to increase the money supply to maintain equilibrium. That's an inflationary result.
If the Dollar price is too low, investors will line up to redeem Dollars for gold and then hoard the gold. Central banks will have to reduce the money supply to maintain equilibrium. That reduces velocity and is deflationary.
Something like the latter case happened in the UK in 1925 when it returned to a gold standard at an unrealistically low price. The result was that the UK entered the Great Depression several years ahead of other developed economies.
Something like the former case happened in the US in 1933, when FDR devalued the Dollar against gold. Citizens weren't allowed to own gold, so there was no mass redemption of gold. But other commodity prices rose sharply.
That was the point of the devaluation. Resulting inflation helped lift the US out of deflation and gave the economy a boost from 1933-1936 in the midst of the Great Depression. (The Fed caused another severe recession in 1937-1938 with their customary incompetence.)
The policy goal obviously is to get the price "just right" by maintaining the proper equilibrium between gold and Dollars. The US is in an ideal position to do this by selling gold from US Treasury reserves, about 8,100 metric tonnes (261.5 million troy ounces), or buying gold in the open market using freshly printed Fed money.
The goal would be to maintain the Dollar price of gold in a narrow range around the fixed price.
What price is just right? This question is easy to answer, subject to a few assumptions.
US M1 money supply is $17.9 trillion. I use M1 because it's a good proxy for everyday money. This is the supply that is the most liquid and money that is the easiest to turn into cash. It contains actual cash (bills and coins), bank reserves (what's actually kept in the vaults) and demand deposits (money in your checking account that can be turned into cash easily).
One needs to make an assumption about the percentage of gold backing for the money supply needed to maintain confidence. I assume 40% coverage with gold. (This was the legal requirement for the Fed from 1913-1946. Later it was 25%, then zero today).
Applying the 40% ratio to the $17.9 trillion money supply means that $7.2 trillion of gold is required.
Applying the $7.2 trillion valuation to 261.5 million troy ounces yields a gold price of $27,533 per ounce.
That's the implied non-deflationary equilibrium price of gold in a new global gold standard. Of course, money supplies fluctuate; lately they've been going up sharply, especially in the US
There's room for debate about whether a 40% backing ratio is too high or too low. Still, my assumptions are moderate based on monetary economics and history. A Dollar price of gold of over $25,000 per ounce in a new gold standard is not a stretch.
Obviously, you get around $12,500 per ounce if you assume 20% coverage. There are many variables in play.
This model is also straightforward. It relies on factors we learned about in our first week of Intro to Economics – supply and demand.
The most significant development on the supply side is the decrease of new mining output. As the chart shows below, mine production of gold in the US has been decreasing steadily since 2017.
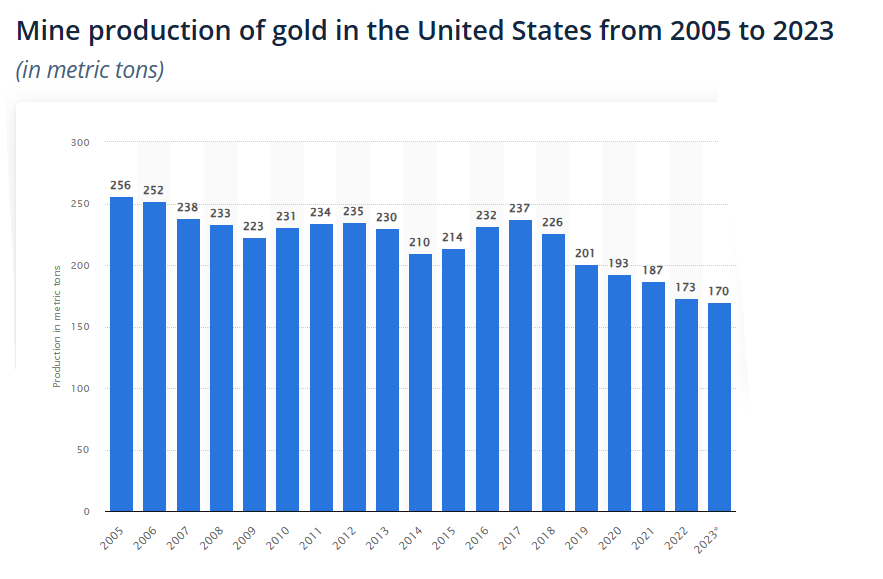
These figures reveal a 28% decrease over seven years, at the same time gold prices were rising and miners were motivated to expand output.
That's not to argue that the world has reached "peak gold," (output could expand in future for a variety of reasons). Still, my contacts in the mining community consistently report that gold is becoming more difficult to source and the quality of newly discovered ore is low-to-medium at best.
Flat output, all things equal, tends to put a floor under prices and to support higher prices based on other factors.
The demand side is driven largely by central banks, ETFs, hedge funds and individual purchases. Traditional institutional investors are not large investors in gold. Much of the demand from hedge funds is conducted in derivatives such as gold futures.
Derivatives generally don't involve physical delivery of gold. They involve "paper gold" that far exceeds the actual, physical gold supply. It's this paper gold market that accounts for volatility in the gold market, not gold itself.
Meanwhile, central bank demand for gold has surged from less than 100 tonnes in 2010 to 1,100 tonnes in 2022, a 1,000% increase in 12 years. Central bank gold demand remained strong in 2023. There's no sign of that demand slowing in 2024.
Overall, the picture is one of flat supply and increasing demand, mostly in the form of official purchases by central banks.
Finally, a bit of elementary math is helpful in understanding how the Dollar price of gold can move past $25,000 per ounce in the next two years. For this purpose, we'll assume a baseline price of $2,000 per ounce (although gold has been in the $2,300 range lately with no signs of falling back to the $2,000 level).
But for our purposes, we'll keep it simple.
A move from $2,000 per ounce to $3,000 per ounce is a heavy lift. That's a 50% increase and could easily take a year or more. Beyond that, a further increase from $3,000 to $4,000 is a 33% increase: another large rally. A further gain from $4,000 per ounce to $5,000 per ounce is a further gain of 25%.
But notice the pattern. Each gain is $1,000 per ounce, but the percentage increase drops from 50% to 33% to 25%. That's because the starting point is higher while the $1,000 gain is constant. Each $1,000 jump represents a smaller (and easier) percentage gain than the one before.
This pattern continues. Moving from $9,000 per ounce to $10,000 per ounce is only an 11% gain. Moving from $14,000 per ounce to $15,000 per ounce is only a 7% gain. Gold can move 1% in a single trading day, sometimes 2% or more.
As an extreme example, a move from $99,000 per ounce to $100,000 per ounce is about a 1% move. Those $1,000 pops get even easier as we approach my calculated gold price of $27,533.
The lesson for you as an investor is to buy gold now.
As prices continue to rally, you'll get more gold for your money at the outset and high-percentage returns as gold rallies from a lower base. Toward the end of the long march past $25,000 per ounce, you'll have bigger Dollar gains because you started with more gold.
Others will jump on the bandwagon, but you'll already have a comfortable seat.


 Email us