Gold: Technical Analysis
A reading of the key technical indicators of RSI, MACD and volume...
The AGE-OLD CONTRAST between fundamental and technical analysis was highlighted last week, writes Brad Zigler of Hard Assets Investor, when a reader of our site commented that:
"I love how commodities investors are focusing on the fundamentals, while people who are currently overweight equities can't shut up about the technicals."
Fundamental analysis uses economic, political and environmental data to forecast future price movements, while technically derived predictions rely upon price patterns and changes in market volume. Commodity traders often use "the technicals" as well as fundamentals when making market decisions.
It should come as no surprise, then, that Hard Asset Investor articles cite metrics from both disciplines to present a broader perspective on a market's potential for consolidation or breakthrough.
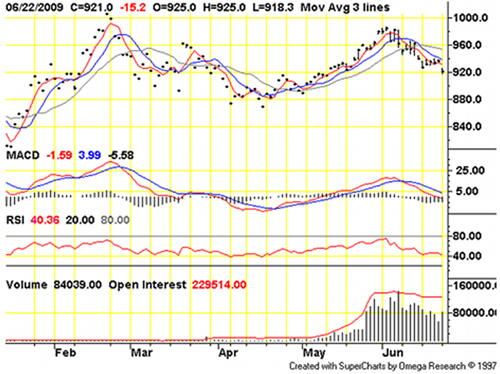
The price charts that accompany many of our articles often include some of these technical indicators. Take, for example, the chart for August Gold Futures below (current as of June 22), showing three technical indicators: MACD, RSI and volume.
Just what are these indicators? What do they purport to show? And why should anyone pay attention to them anyway?
Relative Strength Index (RSI)
Let's first look at RSI, or the Relative Strength Index. RSI assesses the strength of a commodity's price trend by comparing the string of "up" closes to the number of "down" closes over a specific period.
RSI values charted for HAI articles are based upon a 14-day history and range between 0 and 100. On the chart, lines are drawn at the 20 and 80 RSI levels to indicate the thresholds where the market may be overbought (? 80) or oversold (? 20). A top is indicated when RSI peaks through the 80 level and arcs lower; similarly, a bottom is signaled by a trough under the 20 level.
The RSI for August gold charted above is 40.36, neither overbought nor oversold, but clearly trending downward from the early June peak near 80.
It's important to keep in mind that RSI vacillations aren't stand-alone indicators. Like lab tests ordered by your doctor, they can be used to confirm findings made elsewhere or point to areas for further investigation. RSI analysis provides only one indicator of topping or bottoming; further evidence can be found in a commodity's price history and/or other technical indicators.
That said, technically oriented traders look for the same type of patterns in the RSI chart as they see in the daily price bar chart – head-and-shoulder formations, double/triple tops and bottoms, pennants and flags, etc. Often, these patterns are more obvious on the RSI chart than in the bar chart of prices.
Divergences between movements in the price chart and the RSI arc are typically taken as strong indications of market turning points. The end of an uptrend, for example, may be signaled when new highs are scored on the bar chart, but not on the RSI scale.
Moving Average Convergence Divergence (MACD)
MACD is an oscillator used to signal trend changes and market direction. A market's 12- and 26-day exponential moving averages (EMAs) are tracked and used to generate two lines:
Fast MACD - The red line plots the difference between a short (12-day) and long (26-day) moving average of the commodity's price.
Slow MACD - The blue line in the MACD section plots the 9-day exponential moving average of Fast MACD. This line is typically named the "signal" line.
A crossing off the Fast MACD (red) line below the Slow MACD (blue) line, when both indicators are positive (> 0), indicates a market top. Crossovers occurring when both MACD values are negative are ignored.
Likewise, bottoms are confirmed when the faster red line crosses above the slower blue line as long as both indicators are negative.
To better visualize the difference between the MACD values, a histogram, colloquially known as the "forest" line, is plotted in black. Whenever Fast MACD is greater (more positive) than Slow MACD, the forest line value is positive; when FAST MACD is less (more negative) than Slow MACD, the histogram will show a bar sinking below zero.
In the August gold chart, the Fast MACD value is -1.59, while Slow MACD is 3.99. The difference, 5.58, is assigned a negative value because the fast indicator is below the slow indicator. The chart shows the MACD trend is down, with no indication yet of an imminent upside crossover.
Traders use MACD to confirm price trends depicted in the bar chart and to look for areas of divergence. An imminent trend reversal is indicated when there's an incongruence between a price trend and MACD signals.
Volume
The volume section of the chart indicates the number of commodity contracts changing hands on a given day. The greater the volume, the higher the vertical bar on the chart. Volume is a useful measure of the strength of price movements. High volume tends to confirm a price trend, while low volume warns of flagging trading interest, creating doubt regarding the viability of the prevailing trend.
Note how the volume for August gold peaked with the early June market top, then dropped off as priced slipped lower. Volume rose on a short countertrend rally, indicating resurgent bullish optimism. A shift in market mood, however, was signaled by three days of rising prices on declining volume, culminating in a volume upsurge on the bar chart's final gap-lower day.
It should be remembered that volume can sometimes sputter for reasons unrelated to market momentum. Volume, for example, is typically light ahead of market holidays or in the advent of key report or statistical releases.
Open Interest
Open interest, plotted as a red line over the volume histogram, represents the number of commodity contracts outstanding. You can think of open interest in Gold Futures as potential volume. Open interest is created when a new buyer meets a new seller (open interest rises by one contract); it's extinguished when an old seller transacts with an old buyer (open interest falls by one contract). Otherwise (old seller meets new seller or existing buyer sells to a new buyer), open interest remains unchanged.
A decline in open interest indicates liquidation, when market participants close their open positions without being matched by an inflow of fresh bulls or bears. An increase in open interest validates the existing price trend as it indicates increasing participation by new, or incoming, traders.
You have to mindful of normal variances in open interest. Interest in the August gold contract, for example, grew dramatically in mid-May as the result of trend-following traders rolling their positions forward from the soon-to-expire June delivery. Open interest in the August contract, now at plateau, can be expected to begin falling off in mid-July as positions are rolled forward to the active October contract.
The fact that open interest has essentially remained level indicates that there's about as much bearish interest as there was bullish interest in August gold.
In Summary...
Technically, August gold's chart indicates:
- Prices: an intermediate-term downtrend following a failure to score new highs in early June
- RSI: a continuing downtrend
- MACD: a continuing downtrend
- Volume/Open Interest: a recent shift to bearish sentiment, matching the strength of the market's previous bullish conviction
This is clearly not an exhaustive treatise on technical analysis. It's merely a primer on the indicators commonly cited in HAI articles. Neither is this an argument for technical analysis over the fundamental approach. As stated before, most traders use a bit of both disciplines to make market decisions.
Technical analysis has its strengths, most importantly its timeliness. Technical analysis is concerned with what is actually happening in a market. This discipline also has its weaknesses, namely its reliance, for the most part, on normal probabilities and repetition in trading patterns.
Taking all that into consideration, though, there are times when technical analysis may be a trader's only recourse. Sometimes there are simply no guiding fundamentals. Think October 2008. A trader could, in such states, be rudderless without the technicals.


 Email us