Gold vs. Money
Just how much money – and how much Gold – does the world hold today...?
THIS ESSAY compares the money supply of 25 selected economic areas and discusses the ratios between the values of official Gold reserves to outstanding currency, writes Mike Hewitt of Dollar Daze.
These 25 economic areas include 38 countries and make up 89.6% of the world's GDP and 65.1% of the world's population. The Bank of International Settlements (BIS) has a link on their website which lists all of the central banks for different countries.
The following charts use money supply data from these official websites. The link to the raw data is at each country's name.
Gold & Money: Defining Supply
There exists variability in the methodology for calculating different monetary aggregates. This makes cross-country comparisons difficult. Money is defined across a continuum from narrow money that includes highly liquid forms of money (money as a means of exchange) to broad money that covers less liquid forms of money (money as a store of value).
In general terms:
- M0 refers to outstanding currency (banknotes and coins) in circulation excluding vault cash;
- M1 is currency plus overnight (demand) deposits plus vault cash;
- M2 includes the sum of M1 and savings deposits (agreed maturity of up to two years or deposits redeemable at notice of up to three months);
- M3 is the sum of M2 and repurchase agreements, money market fund units, and debt securities up to two years.
Additionally, not every country publishes all four of the common monetary aggregates.
For instance, the Bank of England does not publish official numbers for M1, M2 or M3. For this article, estimates are made using European Economic and Monetary Union (EMU) aggregates for the United Kingdom. These standards are based on those employed by the European Union, of which the UK is a member.
Some countries, such as the United States, do not officially publish M0. So where available, figures for outstanding currency in circulation were used. The US Federal Reserve also ceased publishing M3 data on May 23, 2006. However, various independent sources have continued to publish M3 figures for the US, and one such source is used for US broad money supply.
The money supply levels for each country were converted into US Dollars on July 11, 2008 at the displayed exchange rates for ease of comparison. The last column shows the date at which the money supply data is taken from.
|
Name of Country |
M0 (US$bn) |
M1 (US$bn) |
M2 (US$bn) |
M3 (US$bn) |
Exchange (1USD = ) |
Date Taken |
|
37.7 |
208.0 |
459.3 |
962.0 |
1.0426 AUD |
Apr-08 |
|
|
56.3 |
114.3 |
519.2 |
1,060.8 |
1.6141 BRL |
May-08 |
|
|
Canada |
49.0 |
386.6 |
800.1 |
1,228.6 |
1.0114 CAD |
May-08 |
|
440.5 |
2,236.2 |
6,363.0 |
N/A |
6.8552 CNY |
May-08 |
|
|
10.6 |
162.6 |
211.7 |
237.3 |
4.7401 DKK |
Feb-08 |
|
|
1,013.4 |
6,072.7 |
12,039.9 |
14,197.4 |
0.6355 EUR |
May-08 |
|
|
139.9 |
256.6 |
947.9 |
949.1 |
43.200 INR |
Jun-08 |
|
|
16.6 |
39.7 |
151.9 |
N/A |
9174.3 IDR |
May-07 |
|
|
Japan |
680.1 |
3,641.4 |
6,901.6 |
11,367.9 |
107.01 JPY |
Apr-08 |
|
2.7 |
19.9 |
80.2 |
80.2 |
0.2667 KWD |
May-08 |
|
|
38.1 |
132.0 |
575.0 |
606.4 |
10.310 MXN |
Apr-08 |
|
|
Norway |
8.6 |
144.3 |
281.9 |
N/A |
5.1225 NOK |
Apr-08 |
|
47.4 |
165.1 |
283.0 |
288.2 |
2.0822 PLN |
May-08 |
|
|
Russia |
153.8 |
N/A |
570.1 |
N/A |
23.412 RUB |
Apr-08 |
|
19.8 |
111.6 |
187.2 |
224.9 |
3.7547 SAR |
May-08 |
|
|
12.7 |
52.6 |
233.9 |
240.8 |
1.3607 SGD |
Apr-08 |
|
|
13.9 |
96.2 |
192.1 |
235.2 |
7.7208 ZAR |
May-08 |
|
|
56.7 |
300.7 |
1,350.1 |
2,163.5 |
1000.6 KRW |
Apr-08 |
|
|
16.1 |
222.6 |
N/A |
315.4 |
6.0088 SEK |
Dec-07 |
|
|
Switzerland |
35.4 |
257.3 |
421.9 |
609.5 |
1.0298 CHF |
May-08 |
|
22.8 |
45.2 |
199.7 |
215.5 |
1.2228 TRY |
Jun-08 |
|
|
7.1 |
49.4 |
154.0 |
189.5 |
3.6742 AED |
Dec-07 |
|
|
99.1 |
1,990.7 |
3,291.1 |
3,882.3 |
0.5055 GBP |
May-08 |
|
|
832.6 |
1,388.3 |
7,688.1 |
13,800.0 |
1.0000 USD |
Jun-08 |
|
|
6.2 |
43.7 |
71.9 |
71.9 |
2.1522 VEF |
May-08 |
When considering M3, the total global money supply exceeds $60.2 trillion!
Of this amount, the United States, Eurozone and Japan account for $33.1 trillion or 64.4% of the total. The following graph shows a cross-country comparison for M3.
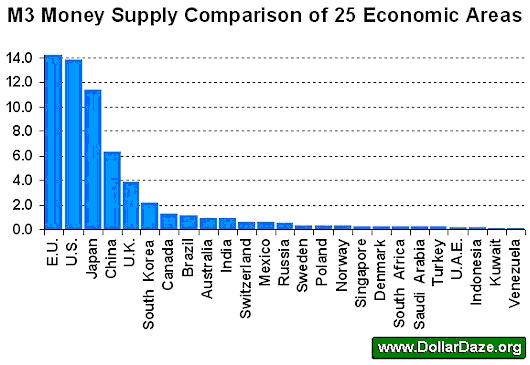
Please note that I've been unable to locate official M3 money supply values for China, Indonesia, Norway, and Russia. For these countries, M2 figures were substituted for M3 in the above figure. As a result, these four countries are underestimated.
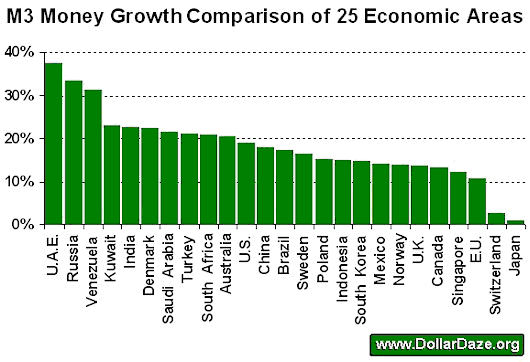
Gold vs. Money: M3 Money Supply Growth
Of the selected economic areas the annual increase of M3 ranges from under 1.0% year over year for Japan to nearly 40% for the United Arab Emirates. And it's clear that higher growth rates for money supply do not translate to overall prosperity in the long run.
If it did, humanity would have eliminated poverty long ago. Instead, what occurs is an inflationary boom followed by a recession. A hyperinflationary period may occur should confidence in the currency vanish.
|
Name of Country |
M0 (Y/Y%) |
M1 (Y/Y%) |
M2 (Y/Y%) |
M3 (Y/Y%) |
Date Taken |
|
5.2% |
3.3% |
16.9% |
20.4% |
Apr-08 |
|
|
21.1% |
16.8% |
26.2% |
17.4% |
May-08 |
|
|
Canada |
3.4% |
7.9% |
8.8% |
13.2% |
May-08 |
|
12.9% |
17.9% |
18.1% |
N/A |
May-08 |
|
|
N/A |
10.5% |
18.5% |
22.3% |
Feb-08 |
|
|
7.5% |
2.3% |
10.1% |
10.5% |
May-08 |
|
|
19.3% |
19.8% |
21.8% |
22.5% |
Jun-08 |
|
|
21.5% |
28.1% |
14.9% |
N/A |
May-07 |
|
|
Japan |
1.86% |
-1.22% |
0.71% |
0.92% |
Apr-08 |
|
10.8% |
28.2% |
23.0% |
23.0% |
May-08 |
|
|
9.2% |
10.2% |
12.0% |
14.1% |
Apr-08 |
|
|
Norway |
10.7% |
7.6% |
14.0% |
N/A |
Apr-08 |
|
5.2% |
17.3% |
16.7% |
15.1% |
May-08 |
|
|
Russia |
25.9% |
N/A |
33.4% |
N/A |
Apr-08 |
|
13.0% |
27.0% |
21.4% |
21.6% |
May-08 |
|
|
9.7% |
29.0% |
11.9% |
12.4% |
Apr-08 |
|
|
14.1% |
12.4% |
19.5% |
20.9% |
May-08 |
|
|
N/A |
-0.6% |
16.3% |
14.6% |
Apr-08 |
|
|
0.5% |
10.7% |
N/A |
16.4% |
Dec-07 |
|
|
Switzerland |
2.1% |
-2.0% |
-4.5% |
2.6% |
May-08 |
|
20.0% |
20.1% |
21.5% |
21.1% |
Jun-08 |
|
|
18.8% |
51.4% |
41.7% |
37.4% |
Dec-07 |
|
|
5.7% |
16.0% |
12.6% |
13.8% |
May-08 |
|
|
1.6% |
1.5% |
6.0% |
18.8% |
Jun-08 |
|
|
1.6% |
1.5% |
6.0% |
18.8% |
May-08 |
The overall weighted annual M3 money supply growth for all areas covered here is 12.4%. (Where M3 figures are not available, M2 figures are substituted.)
Last year, the total M3 money supply for these 25 economic areas was $53.7 trillion. Now it is $60.3 trillion.
The total for M0 (currency in circulation) for the above 25 economic areas amounts to US$3.92 trillion. Using the same calculation as for determining overall M3 money supply growth we find that overall M0 and/or total amount of currency is increasing by 6.6% per annum.
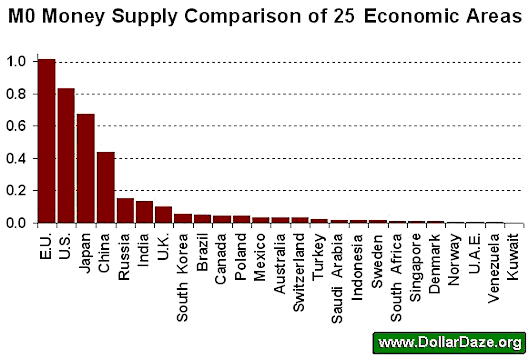
The value for the top three currencies in circulation – the USD, Euro and Yen – comprise 66.2% of the total value of all currencies discussed here.
Gold Reserves Compared to Money Supply
According to the World Gold Council, at the end of 2006 the central banks of the 38 countries within these 25 economic areas held 24,170 tonnes of gold.
This represents 91.3% of the gold held by all countries of the world. At current Gold Prices, the value of the gold held by these 38 countries is $749.2 billion. But the total value of the currency, the actual notes and coins, issued by these countries – $3.82 trillion – nearly five times that figure.
This suggests that, while official gold reserves as a proportion of broad money supply (M3) is barely 1.2%, the value of official central bank gold reserves equals 19.6% of the value of outstanding currency (M0) at present.
The following chart shows a ratio between the value of the official central bank gold reserves to the value of circulating currency.
Note that Norway and United Arab Emirates have no official gold reserves. The 563.1 metric tonnes from the European Central Bank was added to the Euro-Zone, bringing the total for this economic area up to 10,975.3 metric tonnes as of June 2008.
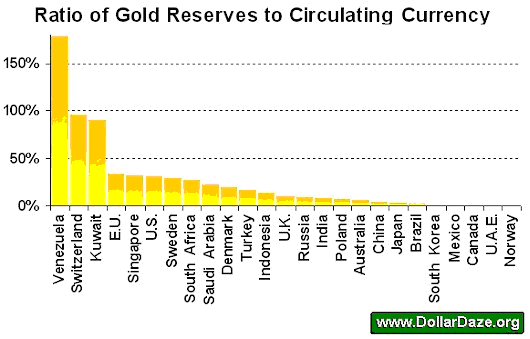
At the time of writing this article, the official gold reserves of Venezuela appears to out-value all of its outstanding currency by 78%. Both Switzerland and Kuwait have gold reserves nearly equal to the value of the currency issued.
Although not included in the analysis, Lebanon has official gold reserves of 286.8 metric tonnes valued at $8.89 billion at time of writing this article. The official statistic for Lebanese currency in circulation is only $2.4 billion. The most recent annual year-over-year growth rate for the Lebanese Pound is 8.3%.


 Email us