How Much Like 1976 is Gold Today?
Tue, 22-Oct-2013 09:09
The gold price drop of 1975-1976 bears comparison...
MARK TWAIN said history doesn't repeat itself but it rhymes, writes Jordan Roy-Byrne, CMT, at TheDailyGold.
We often see that in the capital markets. The big decline in gold this year is reminiscent of that of 1975-1976. Yet, aside from that there are several other similarities between today and 1976. Gold, gold stocks, the stock market and commodities appear to be in a similar position today compared to 1976. We note and discuss the four similarities.
1. Decline in Gold Miner Stocks
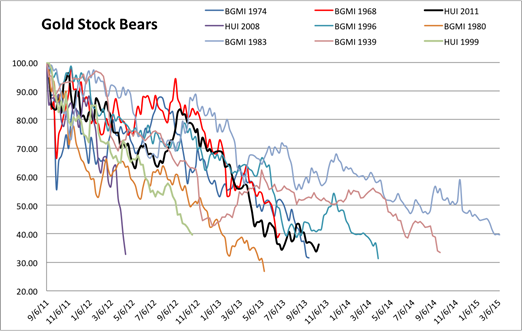
From 1974 to 1976 the Barron's Gold Mining Index declined 67%. From 2011 to 2013, the HUI Gold Bugs Index declined 66%. The chart below is an updated chart of all of the worst cyclical bear markets in gold stocks, dating back to 1938.
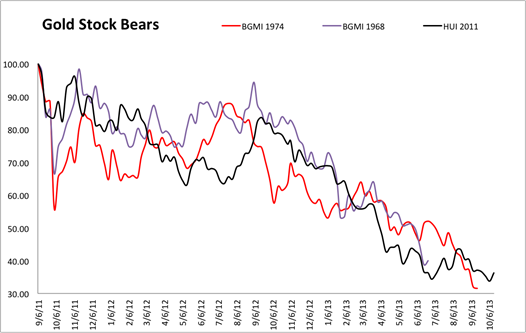
The next shows three of the four major cyclical bear markets which occurred within secular bull markets. (The 2008 bear is omitted). Look at how close the current bear is to the 1974-1976 bear? They are nearly identical in terms of price and time. It's also not far off from the other bear.
2. Gold Miner Stocks vs. S&P 500
While gold stocks experienced a 67% decline from 1974 to 1976, the stock market recovered strongly from the 1973-1974 recession. The chart below (rebalanced) shows the Barron's Gold Mining Index against the S&P 500. The ratio declined 76% from 1974 to 1976.
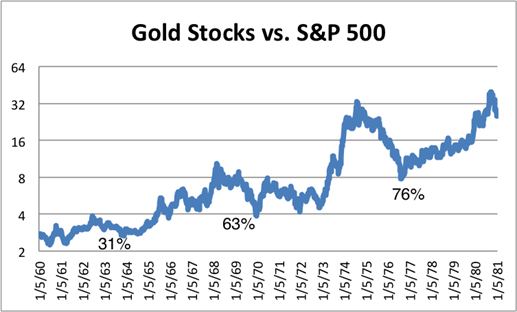
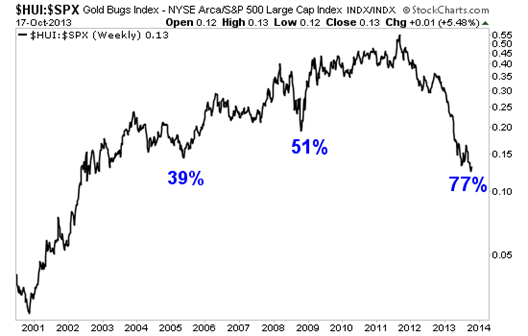
Just like from 1974 to 1976, the gold miners stocks from 2011-2013 have declined 77% when measured against the S&P 500.
3. Decline in Gold Price
From 1974 to 1976 the gold price declined 47%. From its 2011 top to 2013 bottom, gold declined 37%. Why was the decline in the 1970s more severe? Gold was only free trading for less than five years. In that period the price exploded about 457% whereas in the present bull market Gold had risen 650% in 11 years. In the three years prior to its end-1974 top gold gained 333%, which dwarfs the 130% gain in the three years before the 2011 top. These figures explain why gold in the present bull market hasn't had a deeper downturn
4. Relative Strength in Commodities
Typically gold leads an inflationary cycle. Gold leads silver which leads the commodity complex. However, in the mid-to-late 1970s, the CRB index (today's CCI) bottomed before gold. The CRB bottomed at the start of 1975 while gold bottomed in summer 1976.
After gold bottomed, it regained relative strength. Interestingly, silver also bottomed in 1974 and basically held steady for a few years while gold prices declined.
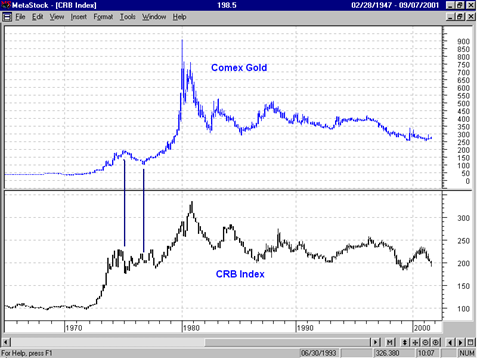
Today, the CCI (old CRB) closed at 519. At the 2012 low it closed at 504. Gold closed at $1541 then and closed today at $1320. The CCI has strongly outperformed gold over the last 17 months just as it did in 1975 and 1976. And in the second half of the 1970s, commodities followed their recovery from the nasty 1973-1974 recession to lead the new inflationary cycle (rather than precious metals).
Could we be seeing the same thing today? There are early indications. Oil has been strong for a while. Wheat and sugar have broken out of their downtrends. Silver has outperformed gold over the last few months.
To conclude, it makes total sense that the current decline in gold prices and gold miner stocks is most similar to the 1976 decline. The current bear market followed 11 years of a bull market while the 1974-1976 correction followed 14 years of a bull market. None of the other bear markets are similar to todays.
The two worst declines were in 1980-1982 (72%) and 1996-1998 (67% in BGMI and 72% in GDM). The 1980 decline followed a 20-year bull market and a parabolic top in the metals. The 1996-1998 bear followed a three year cyclical bull that ended in a mania.
Meanwhile, we've noted the similarities beyond the precious metals sector. The stock market has had a great run and dramatically outperformed precious metals. The economy is several years past a severe recession. Commodities as a whole have held up better than precious metals.
However, this counter trend move of the past two years is nearing its peak and its setting up a great opportunity in gold and silver stocks and a fantastic opportunity in select companies. As this bottoming process in precious metals moves to its final stages, readers are advised to identify the companies with the best fundamentals and growth potential that are showing relative strength. Focus on the leaders and avoid the laggards. If you'd be interested in our analysis on the companies we think poised to lead this new bull market, we invite you to learn more about our service.


 Email us