Trading the Dow-Gold Ratio
You just need $200 and a time machine...
TODAY we take a step-by-step look at the Dow-to-Gold trade, writes Houston Molnar, assistant analyst to Bill Bonner at Bonner & Partners.
To start, let's go over the rules of this long-term trade.
The Dow-to-Gold ratio is Bill Bonner's guide for when to get in and out of stocks.
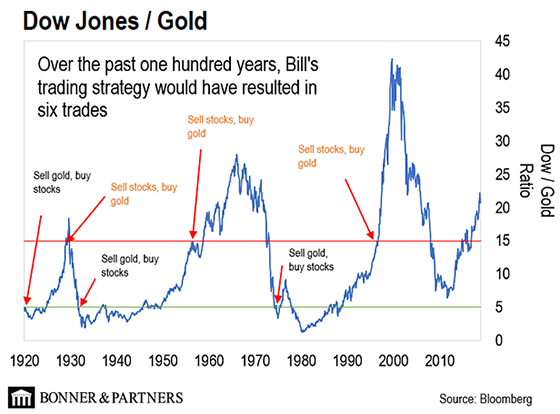
When the ratio goes below 5, we buy equal shares in the Dow Jones Industrial Average index (the Dow). When the ratio goes above 15, we sell the Dow and buy gold.
In other words, when the entire Dow can be bought for five ounces of gold, we buy stocks. When it takes 15 ounces or more to buy the Dow, we sell stocks and buy gold.
Over the past 100 years, you would have made a total of six trades based on this strategy.
To give you a full breakdown of the trade, we start in January 1918 with 10 ounces of gold, which cost us $206.70 ($20.67 per ounce).
Note: Bill's original calculations, starting in 1999, did not account for reinvested dividends from stocks purchased. But to give a fuller picture of the trade, the below calculations are based on the total return.
January 1918
Dow: 76.68 points
Gold: $20.67 per ounce
Dow-to-Gold Ratio: 3.7
Action: Sell Gold, Buy stocks
In January 1918, the Dow-to-Gold ratio is below five. Based on Bill's rules above, we sell our 10 ounces of gold for $206.70 and invest in the Dow, which stood at 76.68 at the time.
February 1929
Dow: 310 points
Gold: $20.63 per ounce
Dow-to-Gold Ratio: 15
Action: Sell Stocks, Buy Gold
In February 1929, the Dow-to-Gold ratio hits 15. We sell our investment in stocks for $1463. This is a return of 608% – including reinvested dividends – since our initial investment in 1918. (The return excluding dividends is 310%.)
We then take this capital and buy 71 ounces of gold, which is priced at $20.63 an ounce.
September 1931
Dow: 99.80 points
Gold: $20.63 per ounce
Dow-to-Gold Ratio: 5
Action: Sell Gold, Buy Stocks
Between 1929 and 1931, the price of gold doesn't move. But by getting out of stocks in February 1929, we have avoided the worst stock market crash in history in October 1929.
Then, in September 1931, the Dow-to-Gold ratio falls below 5. We sell our 71 ounces of gold for $1463.
We then buy the Dow in September 1931 when the index is at 99.80.
September 1958
Dow: 530 points
Gold: $35.10 per ounce
Dow-to-Gold Ratio: 15
Action: Sell Stocks, Buy Gold
In September 1958, the Dow-to-Gold ratio hits 15 once again. We sell our Dow shares, with the index at 530. This gives us $31,084, a return – including reinvested dividends – of 2,025% from 1931. (The return excluding dividends is 430%.)
We then buy 885.58 ounces of gold for $35.10 per ounce.
April 1974
Dow: 839.96 points
Gold: $169.50 per ounce
Dow-to-Gold Ratio: 5
Action: Sell Gold, Buy Stocks
In April 1974, the Dow-to-Gold ratio hits 5. It's time to get back into stocks. We sell our 885.58 ounces of gold for $169.50 per ounce, which gives us $150,105.
We buy back into the Dow at the index level of 839.96.
July 1996-Present
Dow: 5729.98 points
Gold: $382
Dow-to-Gold Ratio: 15
Action: Sell Stocks, Buy Gold
In July 1996, the Dow-to-Gold ratio again hits 15 – time to sell stocks and buy gold.
We sell our Dow shares at an index level 5729.98 for $2.57 million. This is a 1,614% return – including reinvested dividends – from when we purchased the stocks in April 1974. (The return excluding dividends is 549%.)
We take this capital and buy 6,734 ounces of gold, priced at $382 an ounce.
By getting out of stocks and into gold in July 1996, we sit out the current bull market in US stocks. But we also completely avoid the dot-com bust in 2000 and the crash of 2008.
We also get into gold right before gold's bull run from 1999 to 2011. Our final gold ride from 1996 to present returns 226%. That turns our $2.57 million into $8.4 million.
From our $206.70 in 1918, we end up with $8.4 million a century later. That's a total return of 4,058,169%. The annualized return on this strategy would have been 11.19%.
By comparison, a simple "buy-and-hold" investment in the Dow from 1918 to now would have yielded an annual return of 10.44% with dividends reinvested. The gain on this trade would have been $4.26 million.
Similarly, if we had held gold from 1918 to today, our original 10 ounces of gold would now be worth $12,310.
Bill's strategy is based on a simple premise: You make money by buying stocks when they are cheap and selling them when they are expensive. And that's how you turn $206 into $8.4 million over the long haul.


 Email us