Does Gold Rise When Markets Panic? What 16 Fear Events Reveal
When stock markets crash and volatility spikes, does gold protect British investors – and how long do you have to wait?
FEAR is the word most often linked with gold investing. When stock markets tumble and the VIX "fear gauge" spikes, investors are told gold is the place to ride out the storm.
But how does gold actually perform when panic strikes? To find out, BullionVault analysed sterling gold prices around 16 episodes of financial-market stress since 2018. We picked each one using predefined triggers from the VIX volatility index and the MSCI World equity index, not by choosing famous crises after the event.
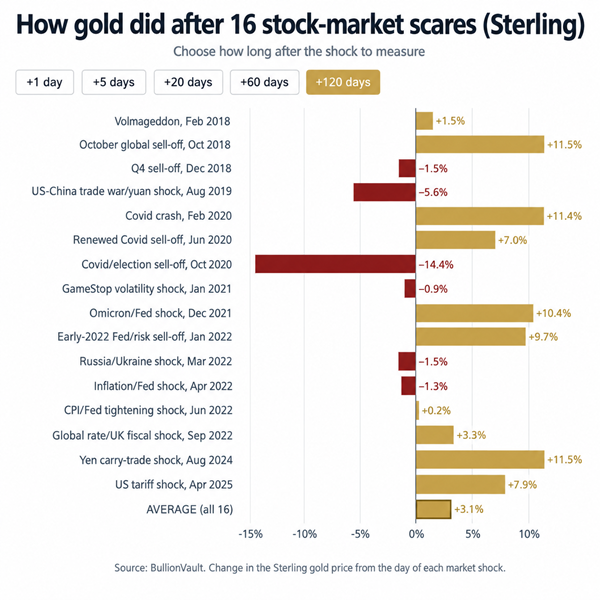
The short answer: gold rose more often than it fell, but its response was rarely as immediate as its safe-haven reputation suggests. Sterling gold was higher one day after 10 of the 16 fear events (62.5% of the time compared to 52.6% for a 1-day rise across the past 10 years), with an average gain of just 0.5%. Give it 120 days, though, and that average gain grows to 3.1%.
How we found the fear events
We looked for fear events using two independent signals:
- Market volatility: the VIX closed at 30 or higher, or jumped sharply over five trading days while reaching at least 25
- Global equity losses: the MSCI World index fell 5% or more over five trading days, or 8% or more over 20 trading days
When both signals fired within the same five-day window, we recorded a fear event. Exceptionally severe days (VIX at 40 or more, or an 8% one-week drop in world stocks) qualified on their own. The gold price played no part in choosing the events.
The result is 16 fear events, from 2018's Volmageddon to the 2025 US tariff shock.
How gold did after 16 stock-market scares (Sterling)
Choose how long after the shock to measure
The average fear-trade: gold after a market shock
Average gold price change across 16 episodes, 2018–2025
The 16 fear events explained
| Fear event | What happened |
|---|---|
| Volmageddon
Feb 2018 |
The VIX, Wall Street’s “fear gauge”, more than doubled in one day. Volatility-linked investment products collapsed, and the Dow Jones fell 1,175 points. |
| October global sell-off
Oct 2018 |
US Treasury yields reached seven-year highs amid strong economic data and inflation concerns, helping trigger a sharp sell-off in technology shares and global stock markets. |
| Q4 sell-off
Dec 2018 |
The Federal Reserve raised interest rates despite growing concerns about economic growth and US–China trade tensions. US stocks suffered their worst December since 1931. |
| US–China trade war/yuan shock
Aug 2019 |
Trump announced new tariffs on Chinese goods. China’s yuan fell below seven to the US dollar, and the US designated China a currency manipulator. |
| Covid crash
Feb 2020 |
The coronavirus spread beyond China, triggering a global stock-market sell-off that intensified in March as lockdowns spread. Investors sold assets, including gold, to raise cash. |
| Renewed Covid sell-off
Jun 2020 |
Rising US infections raised fears of renewed restrictions just as economies were reopening. The Federal Reserve warned that the economic recovery would be prolonged. |
| Covid/election sell-off
Oct 2020 |
Rising Covid cases, renewed restrictions in parts of Europe and uncertainty ahead of the US presidential election unsettled investors. |
| GameStop volatility shock
Jan 2021 |
Retail investors on Reddit helped drive huge gains in GameStop and other heavily shorted stocks. The resulting volatility caused losses for some short sellers and added pressure to other positions. |
| Omicron/Fed shock
Dec 2021 |
The Omicron variant threatened the economic recovery as the Federal Reserve dropped its description of inflation as “transitory” and accelerated the withdrawal of monetary support. |
| Early-2022 Fed/risk sell-off
Jan 2022 |
Expectations of faster US interest-rate rises to combat inflation hit technology stocks, while Russia’s military build-up near Ukraine heightened geopolitical fears. |
| Russia/Ukraine shock
Mar 2022 |
Russia invaded Ukraine on 24 February. Sanctions and fears of disrupted supplies helped drive sharp rises in oil, gas and agricultural commodity prices. |
| Inflation/Fed shock
Apr 2022 |
US inflation reached 8.5% year-on-year in March, its highest rate since 1981. Expectations of aggressive Fed tightening and Covid lockdowns in China heightened concerns about growth and supply chains. |
| CPI/Fed tightening shock
Jun 2022 |
US inflation reached 8.6% in May, its highest rate since 1981. The Fed raised interest rates by 0.75 percentage points, its largest increase since 1994, as US stocks entered a bear market. |
| Global rate/UK fiscal shock
Sep 2022 |
Global rate rises and the UK’s mini-budget triggered turmoil in government bond markets. Sterling hit a record low against the dollar, and the Bank of England intervened to restore orderly gilt-market conditions. |
| Yen carry-trade shock
Aug 2024 |
A Bank of Japan rate rise and weak US jobs data helped strengthen the yen and trigger the unwinding of yen-funded investments. Japan’s Nikkei suffered its biggest one-day percentage fall since 1987. |
| US tariff shock
Apr 2025 |
Trump’s “Liberation Day” tariffs triggered a sharp global sell-off, with US stocks suffering their biggest two-day percentage loss since March 2020. On 9 April, the US announced a 90-day pause on many additional tariffs. |
Russia's invasion: the biggest spike, then the slide
No fear event moved gold faster than Russia's invasion of Ukraine. Sterling gold jumped 3.2% the day after the March 2022 shock. That's more than double the next-best one-day gain (+1.5% after the October 2018 sell-off).
But the rally didn't last. Gold slipped below its shock-day price within a week, and 120 days later it was down 1.5%. That left it 4.6% below the level it reached on day one.
Investors who bought into the headlines bought near the top. As the Federal Reserve started raising interest rates that spring, the war premium faded from gold.
Gold's best gains came later
The pattern runs both ways. Some of gold's weakest starts led to its strongest finishes:
- Covid crash, Feb 2020: gold fell 0.5% the next day and was down 4.8% after 20 days, the worst 20-day result of any event. 120 days later it was up 11.4%
- Omicron/Fed shock, Dec 2021: the worst one-day reaction of all 16 events (−1.1%), yet gold was 10.4% higher after 120 days
That's why average returns grow with time. Sterling gold averaged +0.5% after one day, +0.3% after 20 days, +2.0% after 60 days and +3.1% after 120 days.
The best and worst fear events for gold
Two events share the best 120-day result, +11.5%: the October 2018 global sell-off and the August 2024 yen carry-trade shock.
The worst came after the Covid/election sell-off of October 2020. Gold rose 0.6% in the first week, then slid to finish 14.4% below its shock-day price after 120 days, as vaccine news sent investors back into riskier assets.
Four fear events never resulted in sterling gold close below its shock-day level at any of the five points measured: October 2018, June 2020, August 2024 and April 2025.
2022: the year fear didn't pay
Five of the 16 fear events came in 2022. Gold fell over the following 20 days after four of them, as central banks pushed interest rates up at the fastest pace in decades.
Even the September 2022 mini-budget crisis – a very British fear event – saw sterling gold fall 3.2% over 20 days and 4.3% over 60 days. It recovered to +3.3% after 120 days.
Does your currency matter?
Yes, at least at first. In the first days after a shock, gold priced in pounds did better than gold priced in dollars or euros. The one-day average was +0.5% in sterling, against +0.1% in dollars and +0.3% in euros.
That edge didn't last. After 60 days, dollar gold led (+2.7% vs +2.0% in sterling). After 120 days, euro gold edged ahead (+3.3% vs +3.1%).
So, is gold a safe haven?
The answer depends on how long you're willing to wait. Gold rarely rescued investors overnight, and the shock with the biggest instant spike turned into a loss. But across all 16 fear events, sterling gold was higher in 10 cases after 120 days, and the average gain was 3.1%.
In other words, timing matters, the type of shock matters, and so does the currency you measure in.
Gold and market crash FAQs:
More often than not, but not every time. In our analysis, sterling gold was higher one day after 10 of 16 stock-market fear events since 2018. The average one-day gain was just 0.5%. After 120 days, gold was again higher in 10 of the 16 cases, and the average gain had grown to 3.1%.
Often longer than investors expect. Sterling gold's average gain was +0.5% after one day and only +0.3% after 20 days. It then rose to +2.0% after 60 days and +3.1% after 120 days. In the February 2020 Covid crash, gold was down 4.8% after 20 days but 11.4% higher after 120 days.
Yes, at first. Sterling gold jumped 3.2% the day after the March 2022 shock, its biggest one-day gain of any fear event. But it was below its shock-day price within five days, and down 1.5% after 120 days, as the Federal Reserve began raising interest rates.
In the first days after a shock, yes. The one-day average gain was +0.5% for gold priced in pounds, against +0.1% in dollars and +0.3% in euros. That edge faded over time. After 60 days, dollar gold did best (+2.7%), and after 120 days, euro gold did best (+3.3% vs +3.1% in sterling).
A fear event is a period of sharp financial-market stress identified from two signals: a spike in the VIX volatility index and a steep fall in the MSCI World stock index. Both had to trigger within the same five trading days, unless the move was exceptionally severe. The gold price played no part in choosing the 16 events.